
Using IFIS in the Classroom
The Iowa Flood Information System (IFIS) can support a variety of learning goals in your classroom. The activities below can be used on their own or incorporated into larger lessons and projects. Explore these short modules to see how IFIS can fit into your teaching.
Daily/Weekly Weather Reports
- Select a student weather briefer to report on:
- Local Stream Conditions
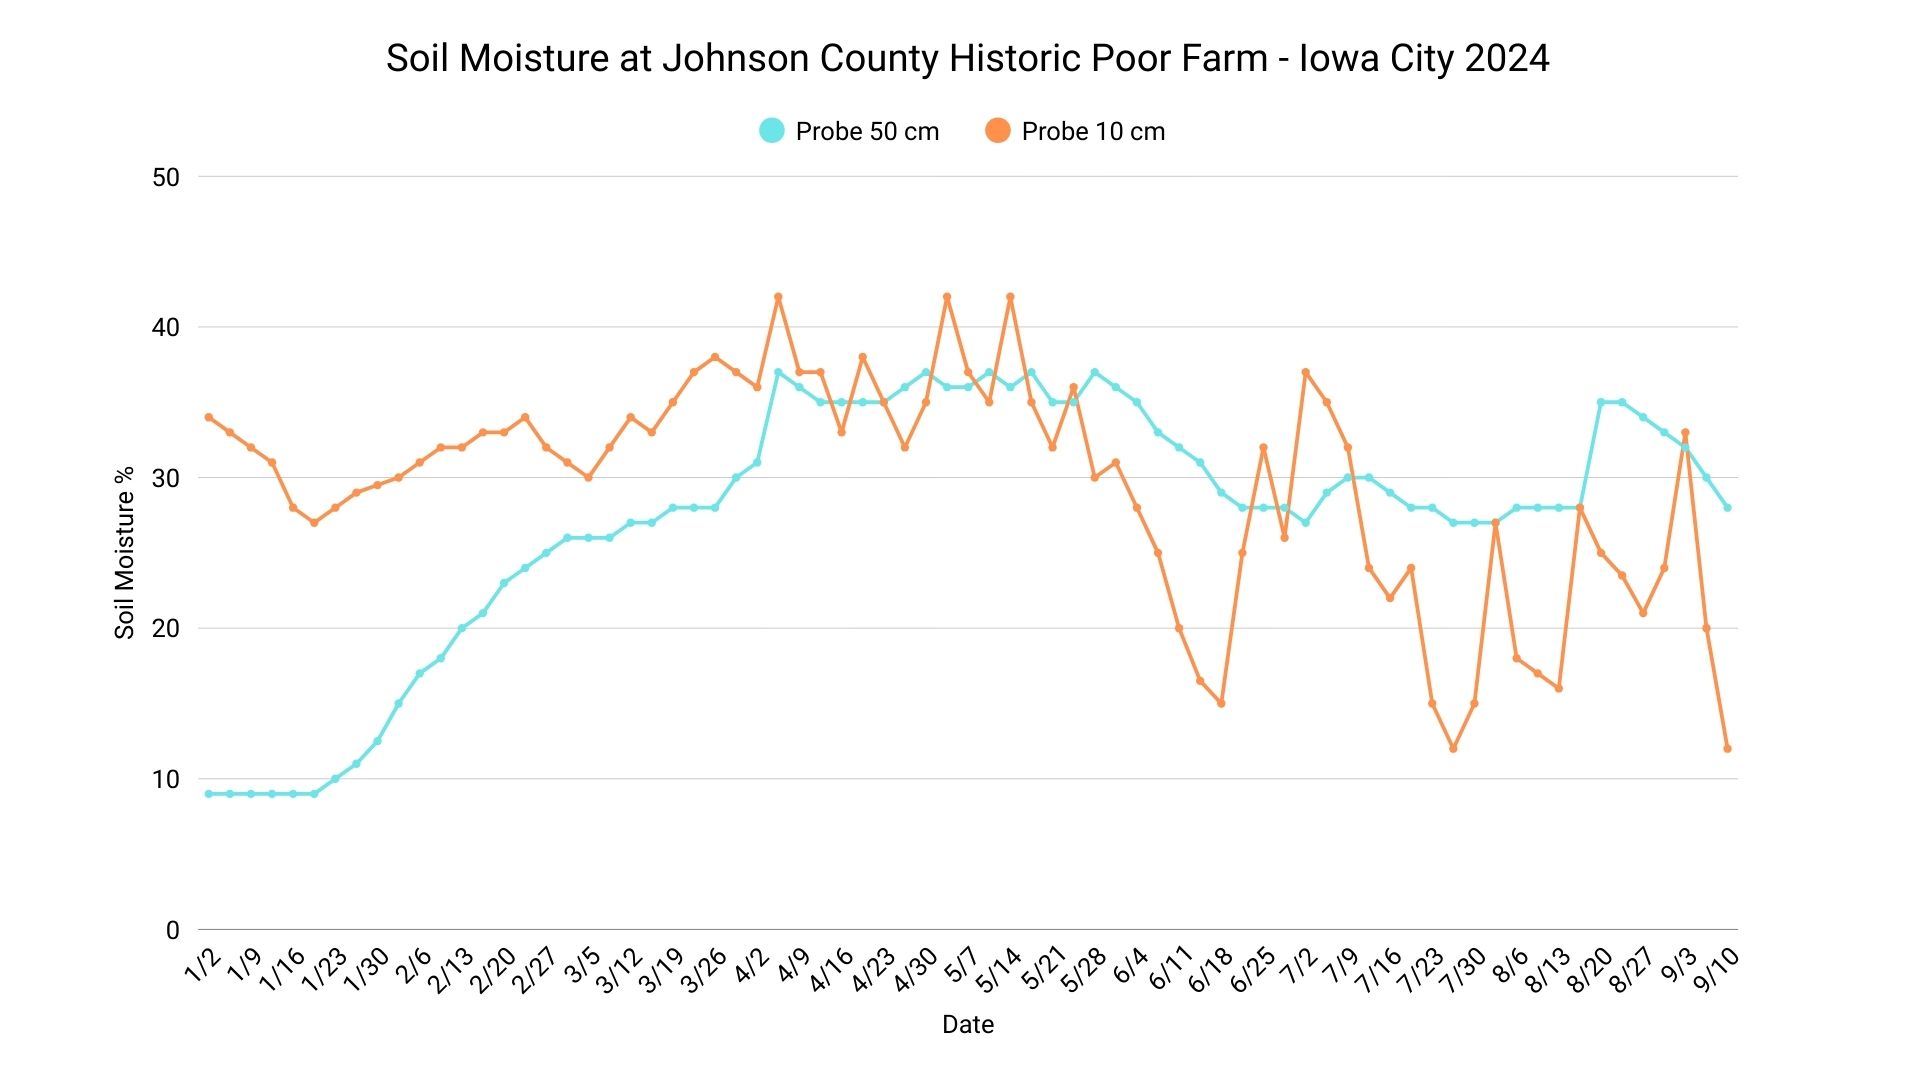
- Local Soil Moisture
- Cumulative and Forecasted Rainfall
- Ask students to make predictions about future conditions
- Soil Moisture
- Stream conditions
For more information or tutorials, view IFIS features.


Create Data Visualizations
- Use daily or weekly weather data from IFIS or Hydroshare to create a classroom graph.
- Elementary – Use chart paper and create a class graph.
- Secondary – Track data in excel and create graph using excel tools.
Hydroshare is a great resource to get long-term hydrologic data from the Iowa Flood Center's sensors. It can provide your classroom with comprehensive data on soil properties, weather conditions, and river stages.

Understanding Potential Flood Impacts
Instructions:
On IFIS, click "community scenarios" under the icon pictured below.

Choose your community.
Adjust river stage and view water depth and damage estimate using the tool bar on the right side of the screen.
Visualizing Your Watershed
Choose any stream stage sensor in or near your community by clicking the icon pictured below on IFIS.

View the highlighted watershed.
Discuss what communities are upstream of where you live and consider how rainfall and stream/river levels in upstream communities might impact where you live.
